The Orlando Devs Slack group was formed in January of 2015. Soon after its conception, an anonymous survey was sent out to its ~20 members. Fast forward one year and this survey became a yearly tradition. In January of 2016 we had a second iteration of the survey completed by ~200 developers in Orlando.
Average Salary by Experience
In this graph we broke down average salaries by years of experience. By looking at this graph we learn just what we expected: the longer you are in the industry, the more money you make.
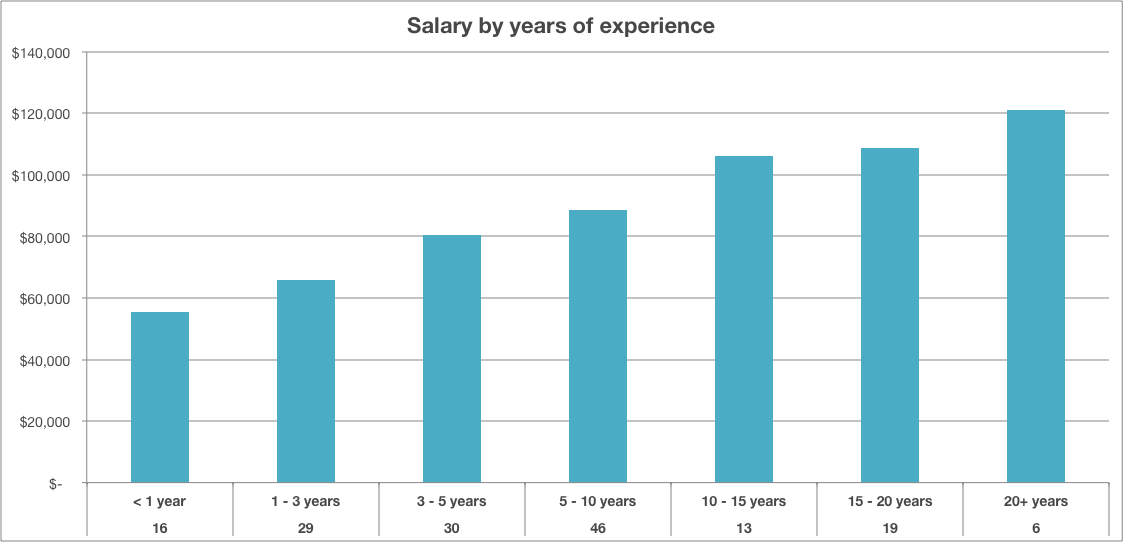
Results filtered to full time employees only.
What this means to you: Focus on perfecting your skills; the money will follow.
Average Salary by College Degree
A question that often comes up is: “Does having a college degree make a difference in our field?” This next graph shows us that it is possible to make a decent living by being a self-taught developer. Our graph shows though that individuals with a Computer Science degree are making more.
A word of warning here: this graph isn’t completely fair as it does not have an experience break down by degree. As seen above, experience is a much stronger defining factor as far as income is concerned. Also, this graph is biased against those who graduated from Coding Bootcamps. This happened because our sample size is tiny (only three responses). On top of that, the Bootcampers who filled out this survey have joined the workforce recently.
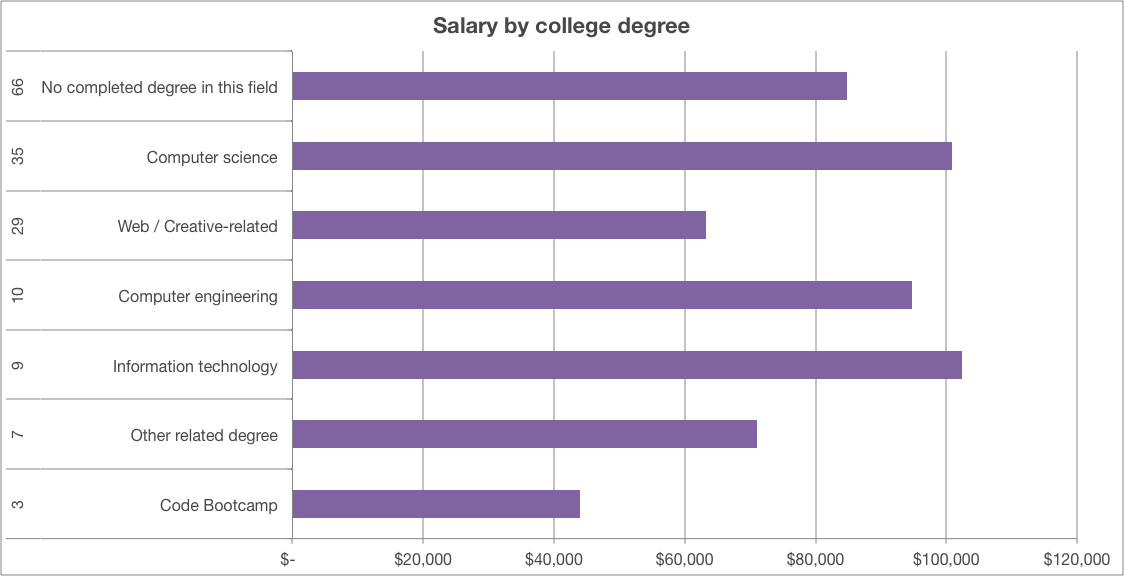
Results filtered to full time employees only.
What this means to you: Getting a college degree is definitely helpful. It shouldn’t be quickly dismissed. However most developers who filled out this survey do not have a degree in this field and are doing very well. We would recommend getting a degree only if you find value in the education and intend to maximize; otherwise your mileage may vary.
Average Salary by Programming Languages
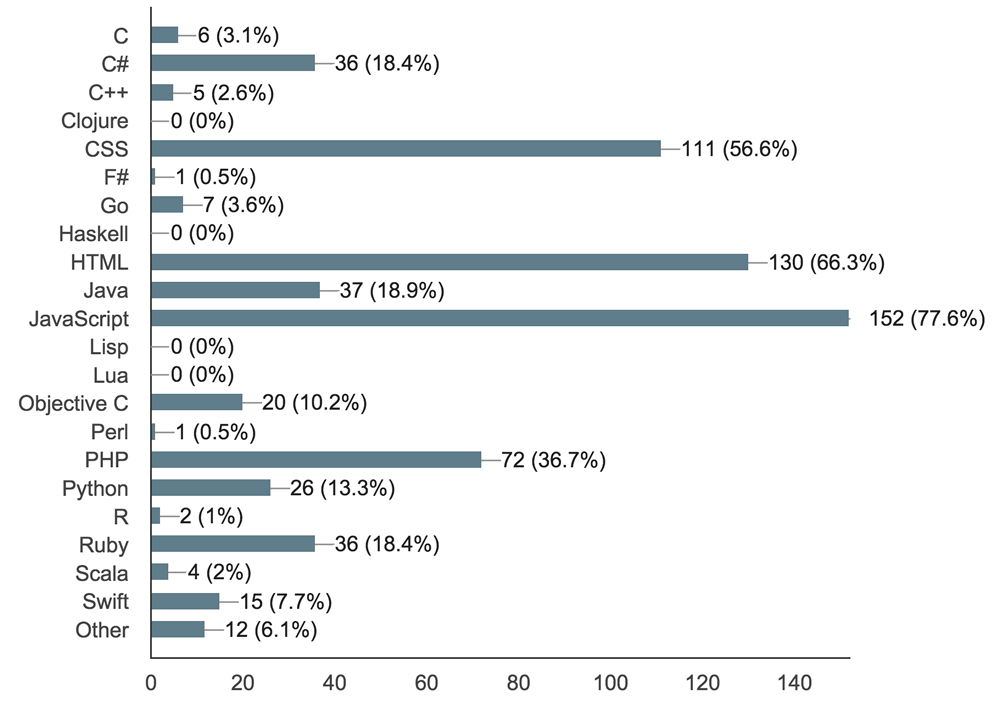
Here we picked the top programming languages within our group. Do look at these numbers with a grain of salt though because of the way this question was asked. Let me explain: We asked individuals to select the programming languages they use daily.
Most individuals in our group selected multiple languages when answering this question. Those who focus on web development for example, may have selected a backend language (ie. Ruby, Java, PHP, etc) in conjunction with HTML, CSS and JavaScript. With this, our average gets a bit more spread out.
What I mean is this: knowing HTML & CSS alone will probably not guarantee you the ~$80K you see in this graph. Also individuals who only do JavaScript daily had an average of ~$97K which is higher than what you see in this graph.
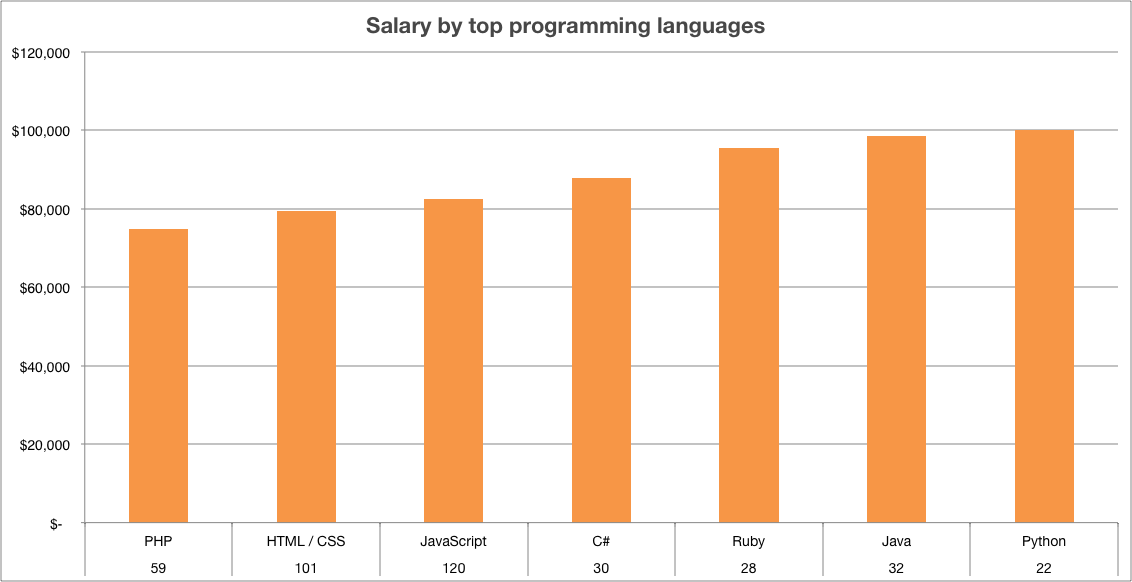
Results filtered to full time employees only.
What this means to you: Having a diverse technical knowledge is still the most effective way of making a good living in our industry. Learning a bit of Java & Python doesn’t hurt either ;)
Impacts of the Choice of a Primary Stack
This next graph shows the impacts of the choice of a developer’s primary stack on their income and PTO. Income and PTO appears to be highly correlated, meaning more pay also comes with more PTO. Conversely that means PTO isn’t really used to offset pay.
Much like the graph above, this graph appears to indicate that Java, Ruby and C# are among the most well compensated. Objective-C / Swift developers appear to be a little bit of an outlier, and while they’re paid similarly to their C# and Ruby peers, they have less favorable PTO policies on average.
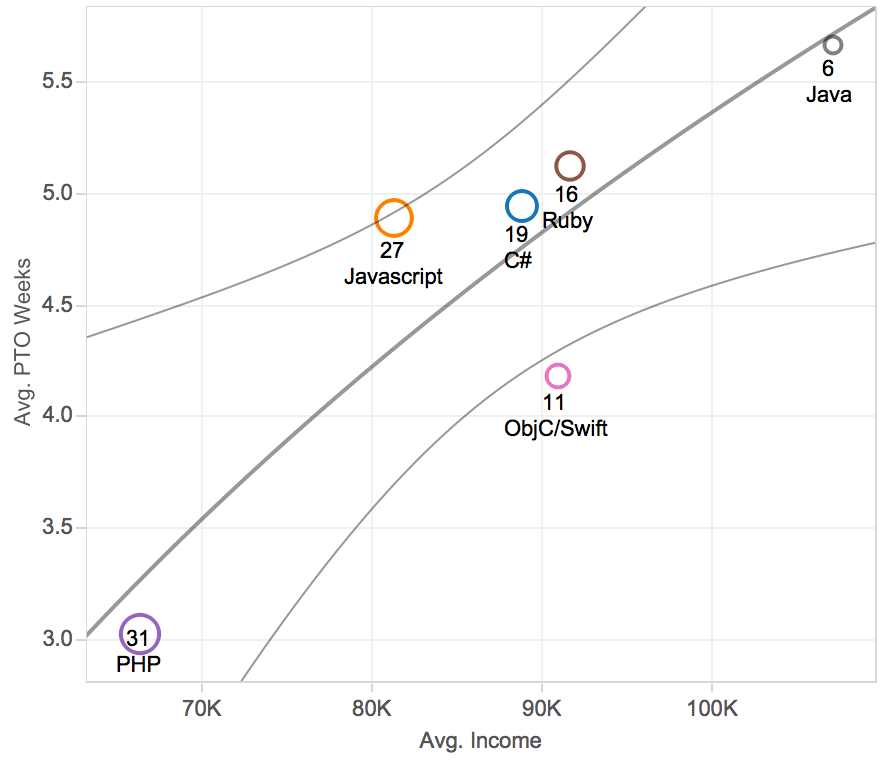
What this means to you: It means you should learn Java. Just playing... well kind of. No seriously, keep negotiating for more PTO along with better salaries as you progress through your career, and keep an eye on these top languages.
Satisfaction by Company Type
A huge part of this survey is assessing developers’ satisfaction in a Established Company versus a Startup. This next graph includes the satisfaction rate by company type and programming languages used.
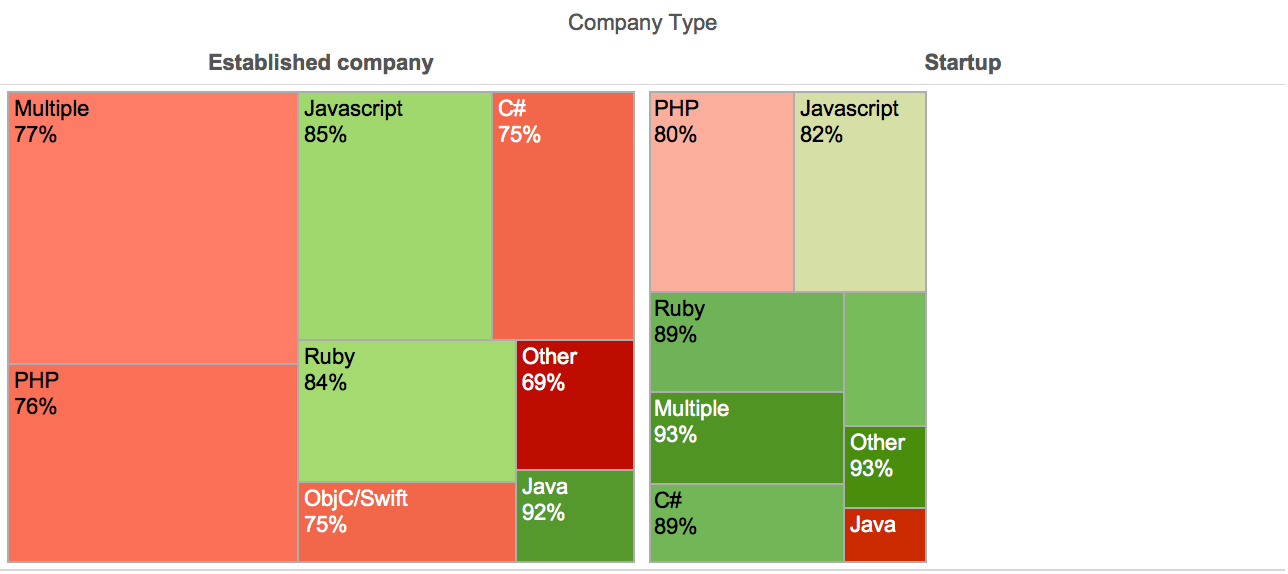
It's important to point out that "Multiple" stands for people developing on multiple stacks, while "Other" are people working with less popular stacks (popular doesn't mean better in this case).
Also, if you're a dummy like me, you might be having a hard time reading this graph. Let's see if the following conclusions can help:
Developers are generally happier at startups
Visually, we can make a hypothesis that people are happier at startups because most of the boxes are green on the right side compared to the left.
Java and C#: the strange outliers
People are really satisfied while writing Java in a established company (green square on the left), however they're a bit miserable writing Java in a startup (red square on the right). Our sample size here isn't massive, it could just be an outlier.
C# on the other hand is the quite the opposite. People are much more satisfied writing C# at a startup than they are at an established company.
What this means to you: Are you unsatisfied at your current position? You might want to consider joining a startup to shake things up a little. It's generally riskier, but comes with an overall higher satisfaction rate (as we'll see in the next few graphs).
Established Companies vs. Startups
Here we'll explore the average pay rate and overall satisfaction at both established companies and startups with a couple of simpler graphs. Also to be taken with a grain of salt since the amount of responses for startups was much lower than for established companies.
Similarly to a graph above, this graph does not take experience into consideration, it's just an average. This means junior developers probably make less than this average shows, and very senior developers make more.
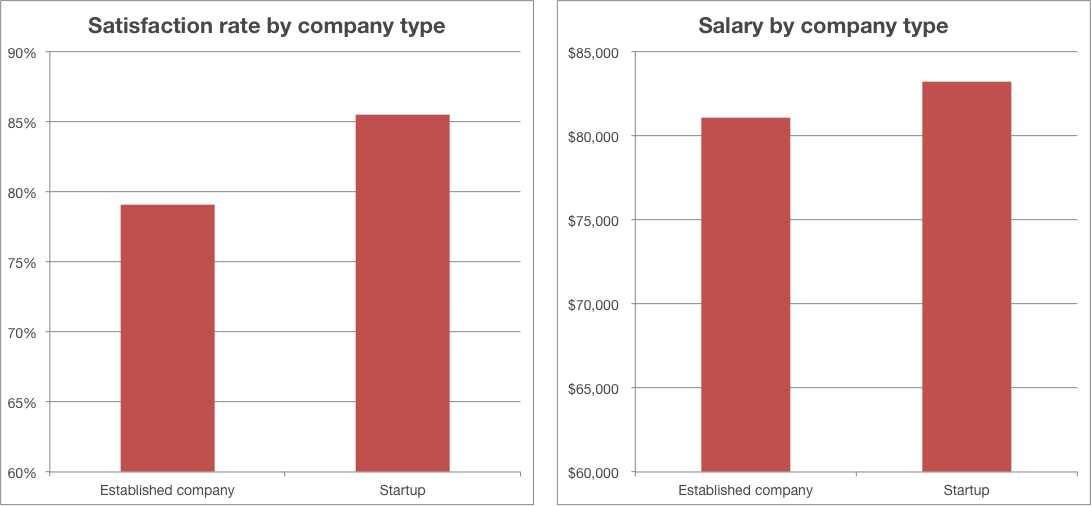
What this means to you: Looking to increase your satisfaction or your income? A startup might be what you're looking for, however it does come with some risk. Truth is, it is generally estimated that 80-90% of startups will fail. Don't let that completely bias you against startups however, as established companies can also undergo organizational changes without failing. (source)
Finally: the results for each question
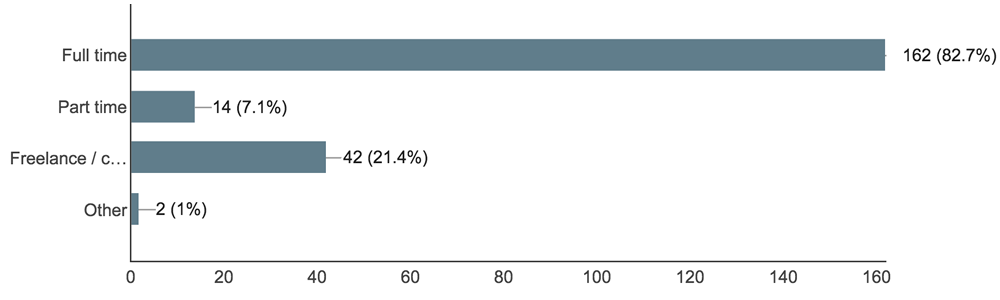
Question 1: What type of work do you do?
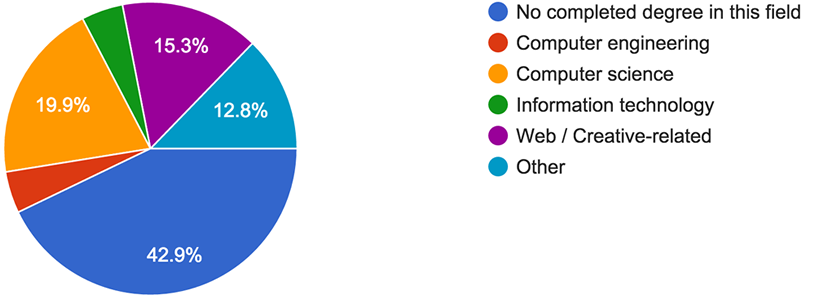
Question 2: Do you have a degree in this field?
Question 3: What programming languages do you work with on a day to day basis?
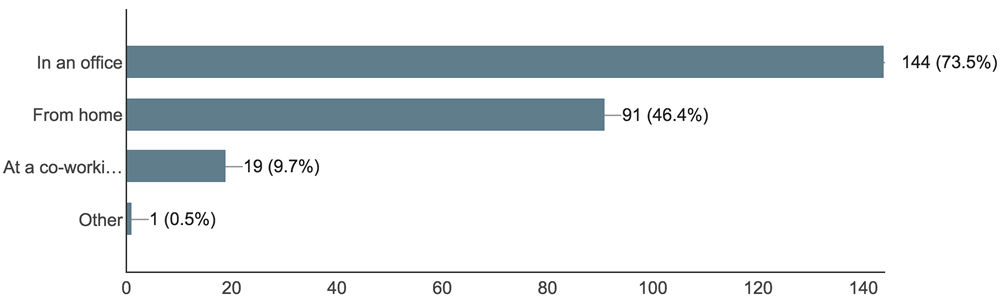
Question 4: Where do you work?
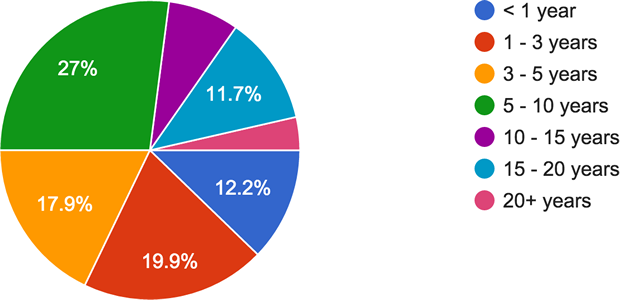
Question 5: For how many years have you been a professional developer in the workplace?
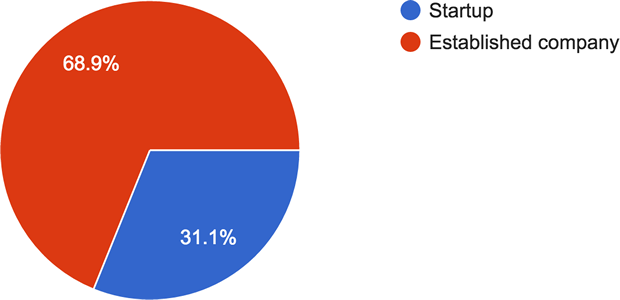
Question 6: Would you say you work at a startup or at an established company?
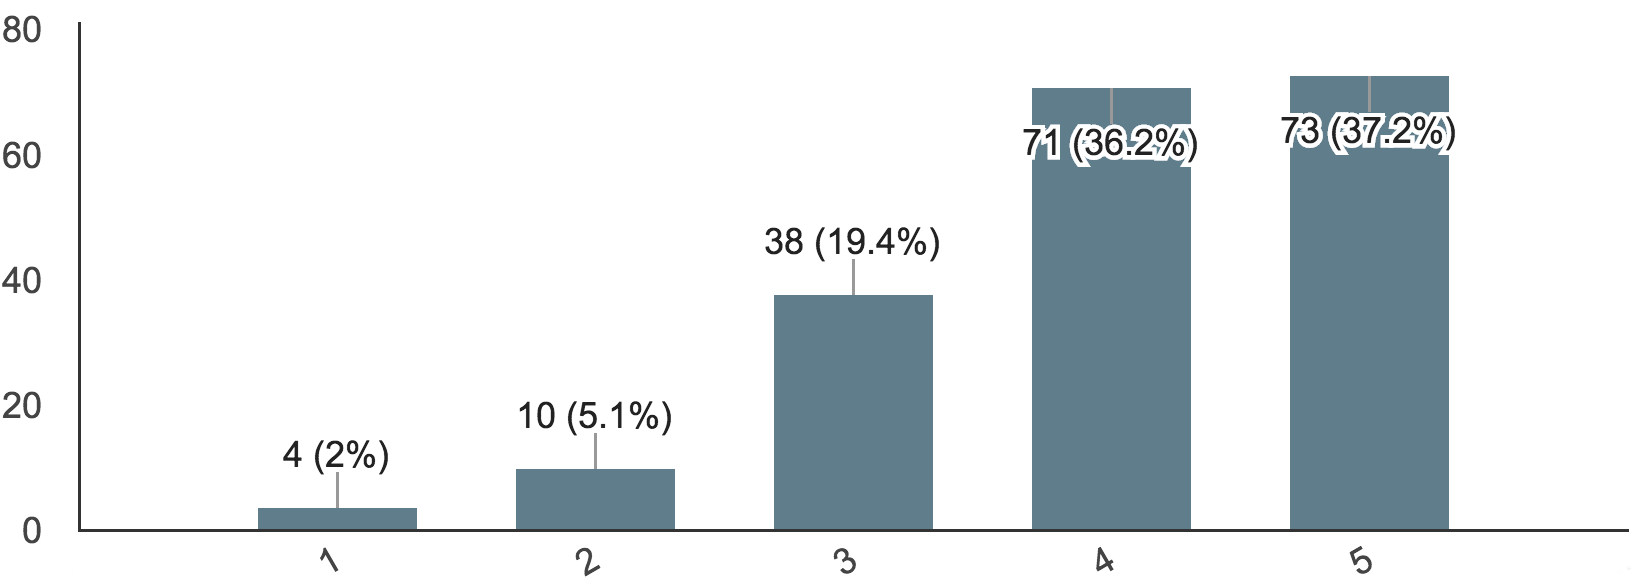
Question 7: How satisfied are you at your current position?
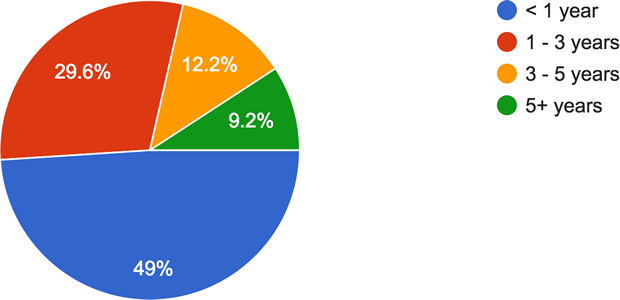
Question 8: For how long have you worked at your current company?
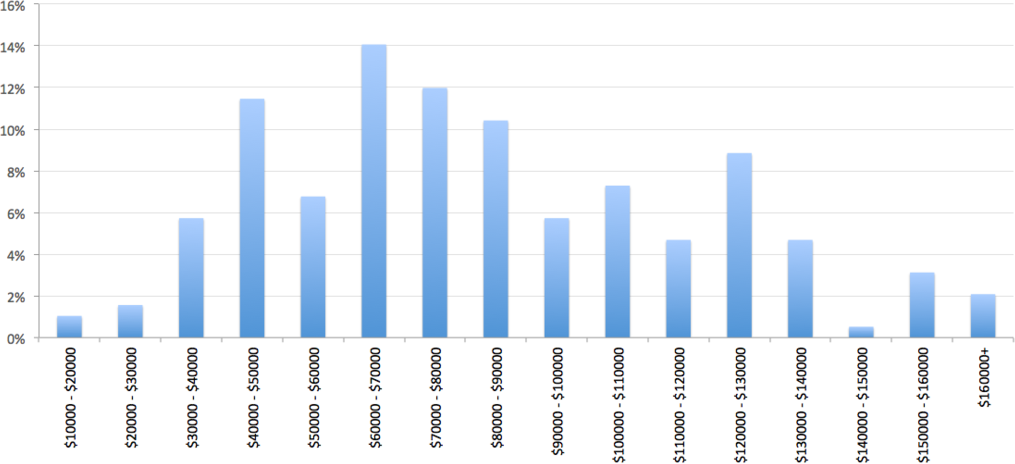
Question 9: At your current pay, how much do you expect to earn in 2016?
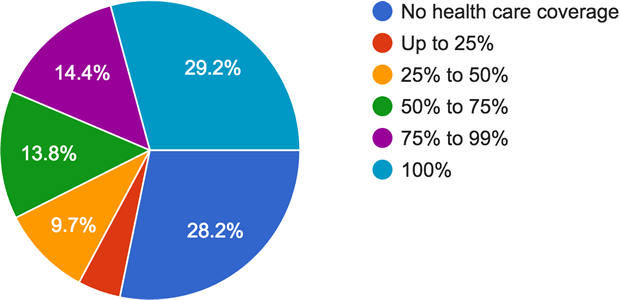
Question 10: How much health care coverage do you get at your current position?
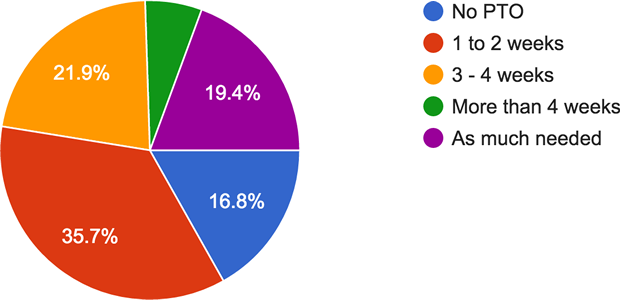
Question 11: How much PTO (paid time off) do you receive yearly?
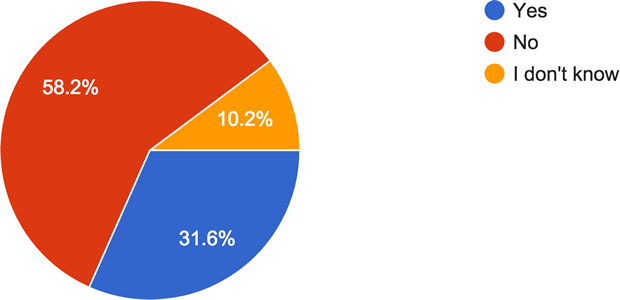
Question 12: Does your company offer equity as part of your compensation package? (stock options, etc)
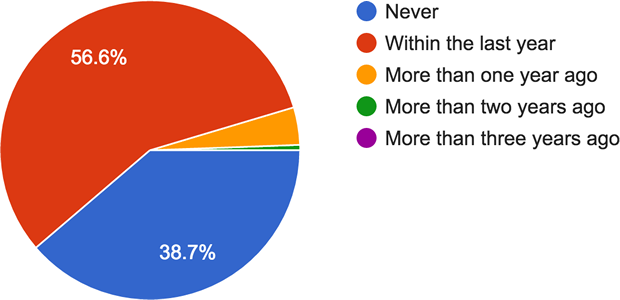
Question 13: When was the last time you got a raise at your current job?
I'm way underpaid, now what?
No need to panic, patience is key when pursuing a greater income. Keep in mind that these are just averages. By nature the data does not measure an individual's set of skills and their ability to negotiate. Selling one's skills to current and prospective employers is crucial.
With this in mind, our goal for the Orlando Devs monthly meetup is to make better developers here in Orlando. Our monthly meetings cover diversified technical skills so you can stay on top of your game, as well as soft skills such as salary negotiation, project estimation, etc.
We also have one-off events that happen every now and then covering interview preps and such. Follow us on Twitter (link below) to learn more about these events.
A big thanks to:
A huge thanks goes to everyone who participated in this survey. Also a huge thanks to the data crunching team who worked tirelessly to come up with these graphs (in alphabetic order):
- Brandon Groves (GitHub)
- Bruno Genaro (Twitter / Blog)
- Jacques Fu (Twitter / Blog)
- Jeremy Privett (Twitter / Website)
- Matt Mazur (Twitter / Website)
- Ravel Antunes (Twitter / Website)
- Sergio Cruz (Twitter / Website)
Got questions?
If you're curious to see any other potential correlations we might have left behind, or just want to chat about this data, please feel free to contact us:
By Twitter: @OrlandoDevs By Email: orlandodevcommunity@gmail.com